Visualisation of Sensor Data from Animal Movement |
|
- New Scientist Article featuring Grundy's nice work.
- Infosthetics Article on the EuroVis 2009 Conference.
- Charl Botha's EuroVis 2009 conference report.
- Enrico Bertini's EuroVis 2009 conference report.
(Click on images for MPEG animations)
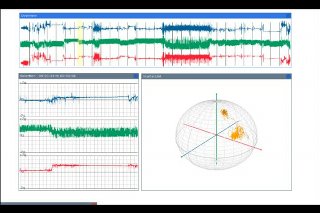
Interactive Brushing and Clustering
A state transition diagram of different animal behaviors.
Visualization of combined acceleration and pressure.
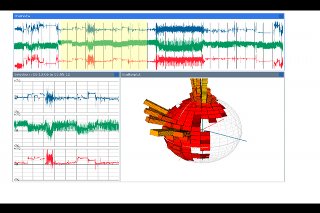
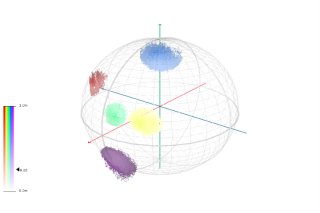
Interactive polar histograms of acceleration.
Interactive brushing of state probabilities.
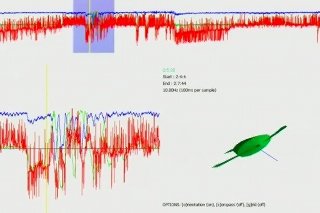
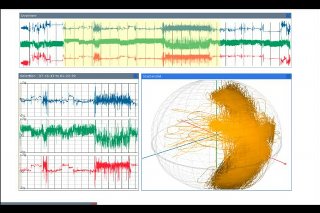
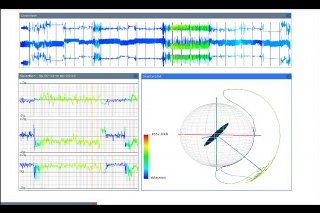
This visualization shows an animation of animal orientation.
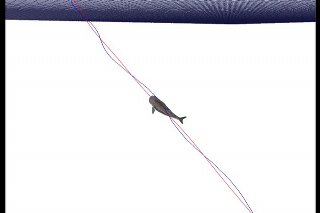
Body motion: This data contains an extra attribute indicating the path the animal has travelled, allowing a full reconstruction of movement behaviour. Because the sensor was attached near the tail of the fish, tail beats are present in the data. By taking a moving average of the location, we can deform the mesh based on the difference between the moving average (which we assume to be the body) and the raw data (which we assume is the tail), giving a simple representation of body movements.
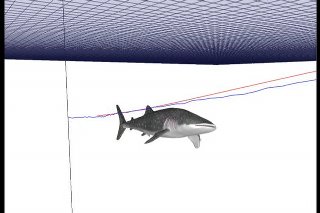
An animation of the whaleshark swimming.